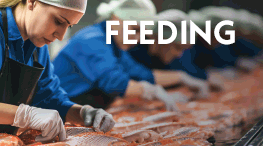
The fishery and aquaculture sector in Bosnia and Herzegovina (BiH) includes artisanal and recreational fisheries on marine and inland waters. The main types of aquaculture production systems are pond, tank and cage cultures. Farmed production is predominantly fish, with only a small cultivation of molluscs.

Bosnia and Herzegovina is located in the western part of the Balkan Peninsula and covers an area of just over 51,000 km2. It borders Serbia to the east, Montenegro to the south east, Croatia to the north and west, and has a 12 kilometer coastline on the Adriatic Sea. The landscape varies from mountains to arable land in the north and Mediterranean vineyards in the south. Most of the major towns are located in valleys. Climatically, Bosnian summers last from May to September and are warm and humid, whilst winters tend to be foggy and snowy and last from November to February. Autumn and spring are usually short.
Bosnia and Herzegovina consists of two entities and the Brcko District (BD). One of the entities, the Federation of Bosnia and Herzegovina (FBiH), covers 50 percent of the territory, while the other, Republika Srpska (RS), has about 49%. Brcko District covers the remaining one percent of the total territory.
| Bosnia and Herzegovina in a nutshell | • Total Area: 51 thousand km2 • Population: 3.83 million • Currency: Convertible Marka (BAM), BAM1 = EUR0.51 • Capital: Sarajevo |
• Major languages: Bosnian, Croatian and | ||||
| Bosnia and Herzegovina in a nutshell | |||||||
| • Total Area: 51 thousand km2 • Population: 3.83 million • Currency: Convertible Marka (BAM), BAM1 = EUR0.51 • Capital: Sarajevo |
• Major languages: Bosnian, Croatian and | ||||||
|
| Selected economic data of Bosnia Herzegovina | • GDP: EUR13,485 million (2013) • GDP per capita: 3,518 € (2013) |
• Agricultural GDP: 18.5 % (2013) • Main export products: Wood and paper, metal products | ||||
| Selected economic data of Bosnia Herzegovina | |||||||
| • GDP: EUR13,485 million (2013) • GDP per capita: 3,518 € (2013) |
• Agricultural GDP: 18.5 % (2013) • Main export products: Wood and paper, metal products | ||||||
Abundant sources of freshwater
BiH is rich in high quality water resources. All natural waters in BiH are owned by the state, or by the two entities and the Brcko District (BD) that constitute BiH. These ownership rights can be given or leased to public and private organisations. The authorities within the entities and the BD responsible for water resource issues are the Ministry of Agriculture, Water Management and Forestry (MAWMF) in FBiH, the Ministry of Agriculture, Forestry and Water Management (MAFWM) in RS and the Department of Spatial Planning in BD. The amount of Total Renewable Water Resources (TRWR) is 37.5 km3 per year. The dependency ratio is only 5.3 percent, which is exceptionally favorable. Rivers in BiH – a total of about 1,125 m3 per sec – flow either northward through the Danube into the Black Sea (62.5 percent) or southward into the Adriatic Sea (35.5 percent). Within the two main drainage basins nine river basins exist including Korana/Glina, Bosna, Una, Vrbas, Sava, Krka-Cetina, Neretva, Drina and Trebisnjica.
The hydrological characteristics and capacities of the country are determined by geomorphological and hydrogeological factors. The Dinara Mountains and the Alps cause high amounts of precipitations. Together with the extensive underground hydrological potential of the karst region’s water retaining capacity it is able to feed the numerous river-sized springs. Consequently, the majority of rivers originate from karst underground waters and strong springs. Waters originating in the country flow through more than a total of 20,000 km long, dense web of streams and rivers. The total length of the main rivers is 2,630 km while the estimated total length of all water flows longer than 10 km is about 9,000 km.
In addition to the huge and dense web of rivers, there are a total of 59 natural and artificial lakes in BiH, 36 of which are natural lakes. Their total area is about 3,111 ha. Comparing the total size of natural lakes with the size of BiH, it is around one-tenth of the world average. In mountainous regions natural lakes have been important drinking water sources for animal husbandry. Though natural lakes have no economic importance they could still play a special role in sport fishing tourism. Furthermore, for flood control, water accumulation/storage and electricity generation, 23 water reservoirs have been constructed with a total area of 18,773 ha.
| Table 1: Aquaculture facilities | Size of the facilities | 2012 | 2013 | Trout fishponds (sq. m) | 91,759,60 | 85,367,30 | Carp fishponds (ha) | 2,130,10 | 2,099,00 | Cages (cubic m) | 109,197,20 | 102,948,30 | |||||||||||||||||||||||||||||||||||||||||||
| Table 1: Aquaculture facilities | ||||||||||||||||||||||||||||||||||||||||||||||||||||||||
| Size of the facilities | ||||||||||||||||||||||||||||||||||||||||||||||||||||||||
| 2012 | 2013 | |||||||||||||||||||||||||||||||||||||||||||||||||||||||
| Trout fishponds (sq. m) | 91,759,60 | 85,367,30 | ||||||||||||||||||||||||||||||||||||||||||||||||||||||
| Carp fishponds (ha) | 2,130,10 | 2,099,00 | ||||||||||||||||||||||||||||||||||||||||||||||||||||||
| Cages (cubic m) | 109,197,20 | 102,948,30 | ||||||||||||||||||||||||||||||||||||||||||||||||||||||
| Table 2 Fish production, tonnes | 2010 | 2011 | 2012 | 2013 | Trout | 2900,9 | 3052,8 | 2818,0 | 2381,8 | Carp | 1355,8 | 925,8 | 573,2 | 317,0 | Other | 355,0 | 250,0 | 193,0 | 154,5 | Total | 4611,7 | 4228,6 | 3584,20 | 2853,30 | |||||||||||||||||||||||||||||||
| Table 2 Fish production, tonnes | ||||||||||||||||||||||||||||||||||||||||||||||||||||||||
| 2010 | 2011 | 2012 | 2013 | |||||||||||||||||||||||||||||||||||||||||||||||||||||
| Trout | 2900,9 | 3052,8 | 2818,0 | 2381,8 | ||||||||||||||||||||||||||||||||||||||||||||||||||||
| Carp | 1355,8 | 925,8 | 573,2 | 317,0 | ||||||||||||||||||||||||||||||||||||||||||||||||||||
| Other | 355,0 | 250,0 | 193,0 | 154,5 | ||||||||||||||||||||||||||||||||||||||||||||||||||||
| Total | 4611,7 | 4228,6 | 3584,20 | 2853,30 | ||||||||||||||||||||||||||||||||||||||||||||||||||||
Characteristics of the fisheries sector
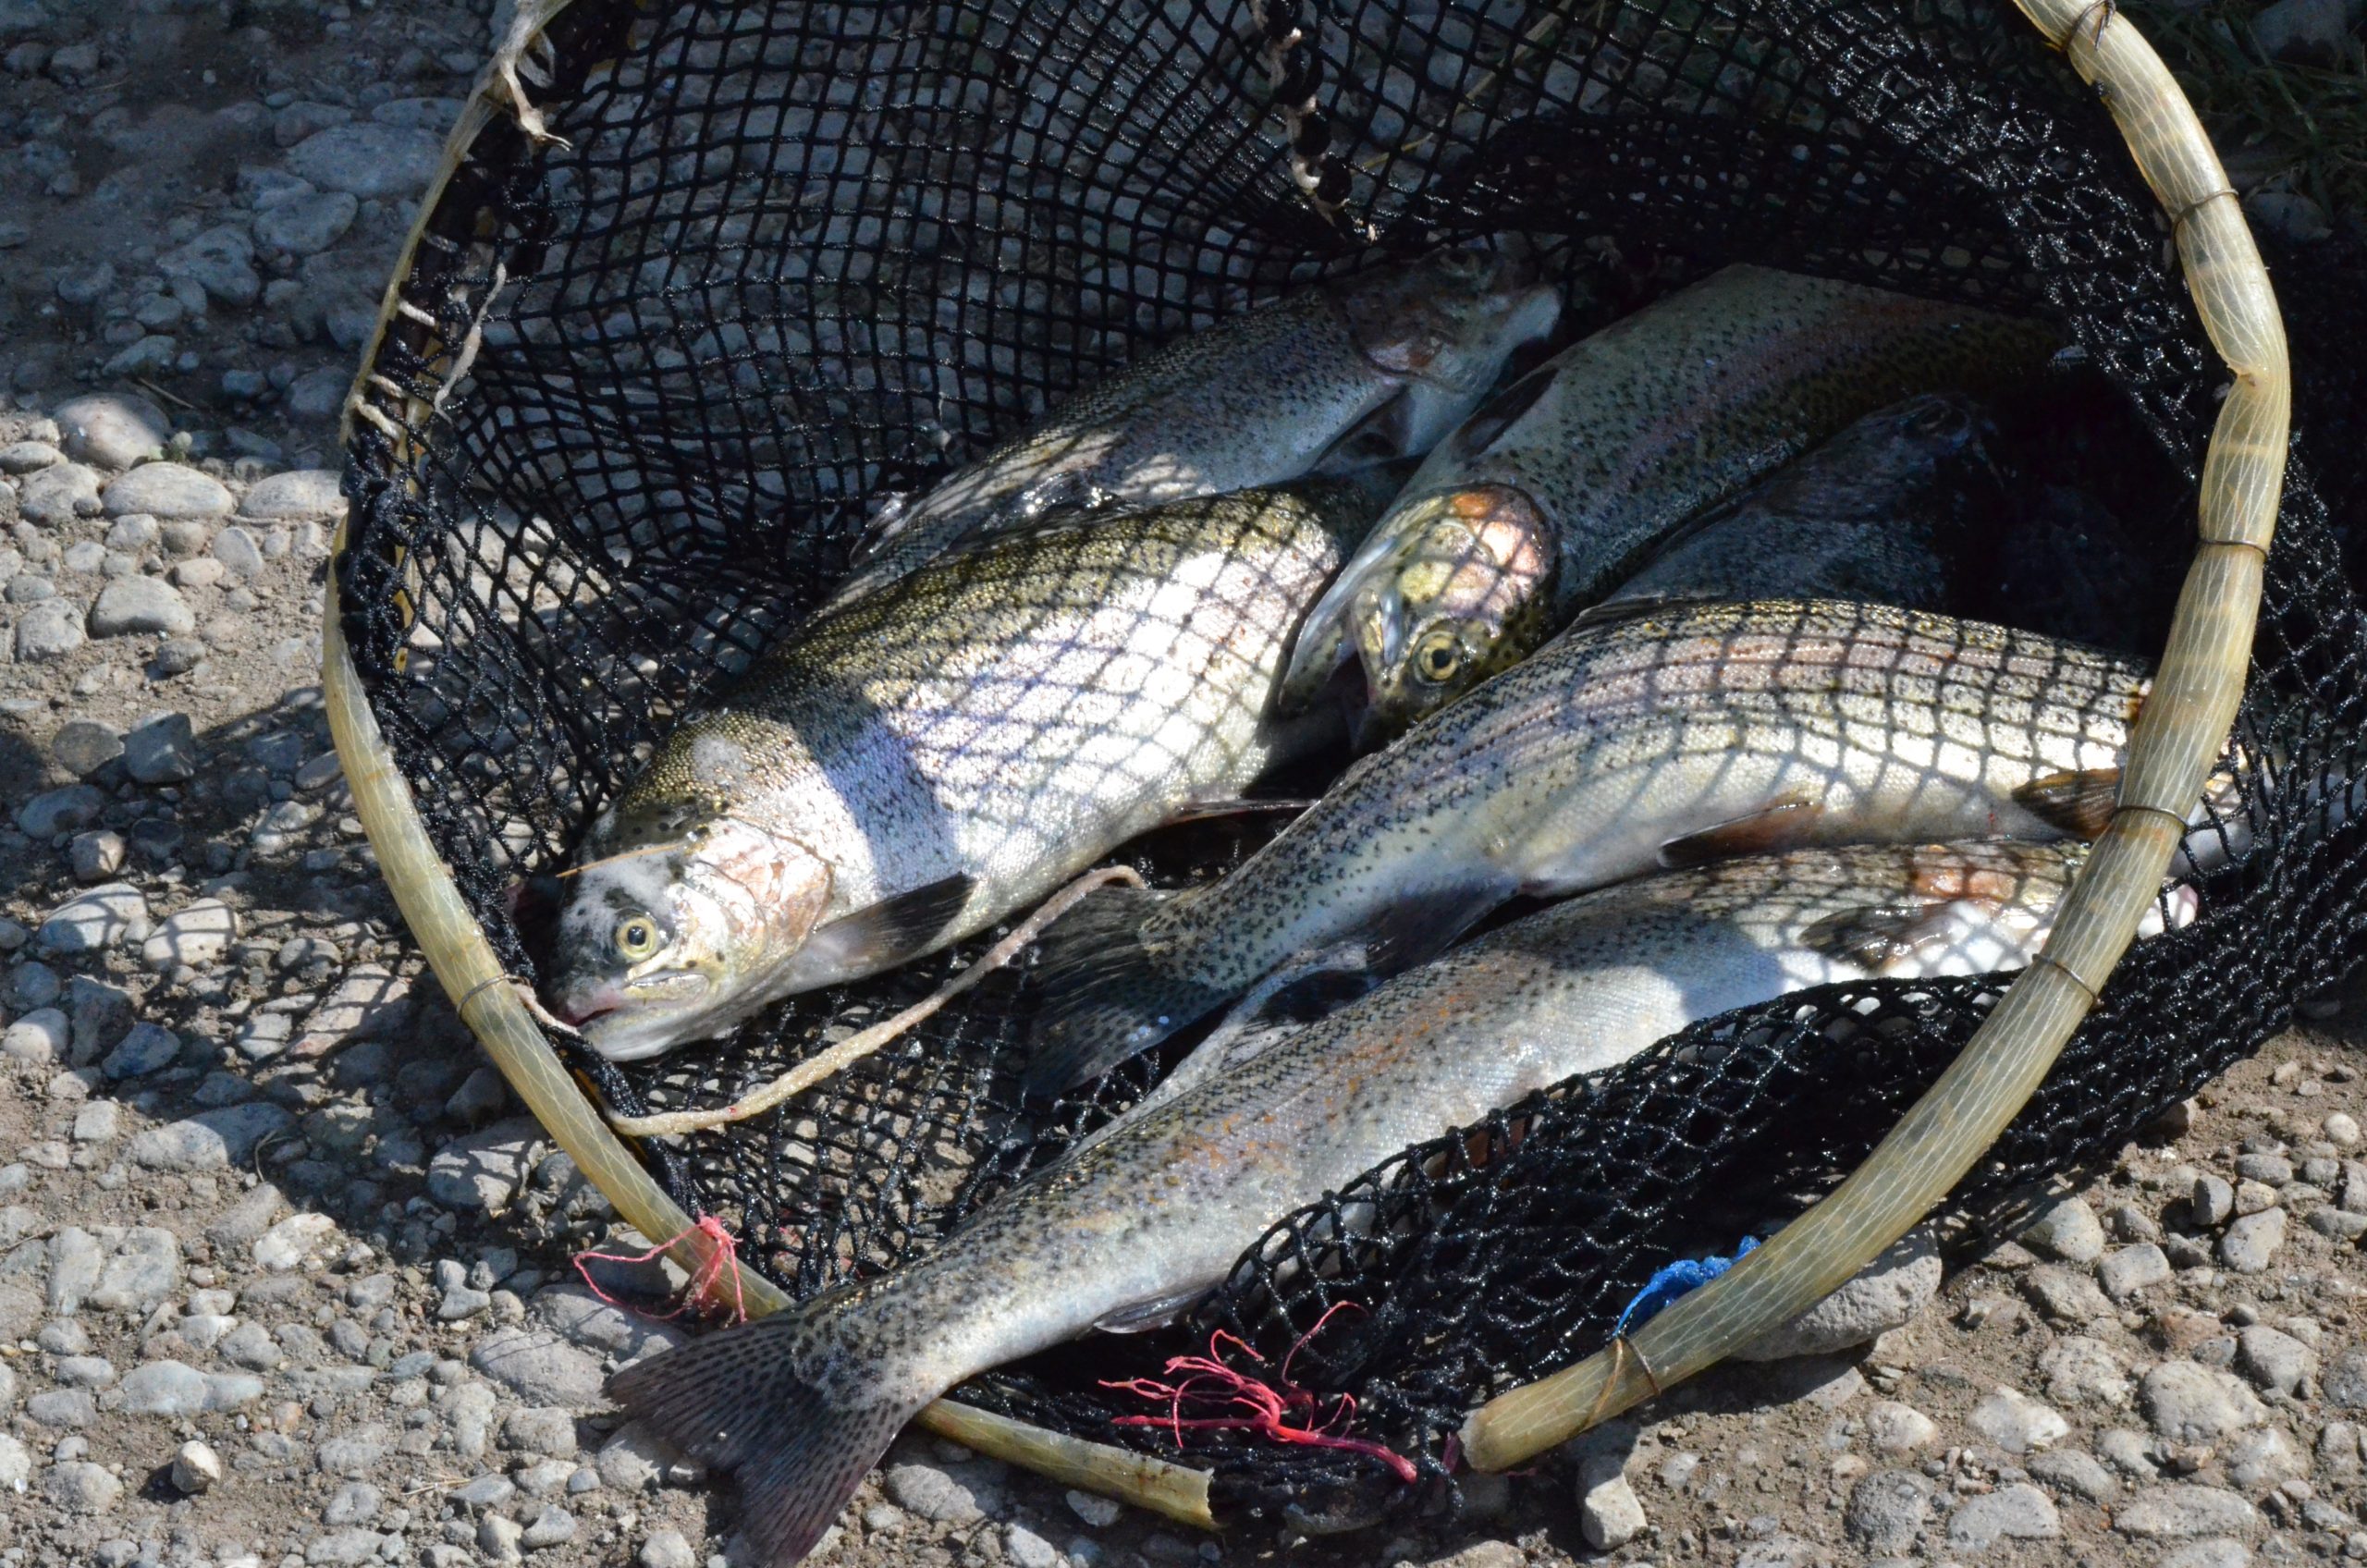
There are 213 species of fish fauna in Bosnia and Herzegovina. Seventy six (36 percent) of them are marine, such as seabass, sea bream, 26 (12 percent) are diadromous, and 111 (52 percent) are freshwater fish species, including carps, catfish, pike-perch, tench, and trout. There are a total of 164 angling associations with about 17,000 licensed members.
Aquaculture enterprises operating in the country number some 125. The licensing procedure for both fisheries and aquaculture is rather complicated, as a result about 40% of the fish farms are not yet licensed in BiH. Though subsidies for the sector are available in the two entities (in BD this is entirely missing) they are difficult to obtain due to complex administrative procedures. There are two development banks (one for FBiH and one for RS) which finance small and medium-sized enterprises, but access to loans is not easy due to complex administrative procedures. Twenty-eight commercial banks act as partners of the development banks, but they do not have their own loan products for fisheries and aquaculture, while the eight micro-credit institutions are considered too expensive to deal with.
Domestic and international markets
The Agricultural Department of the Foreign Trade Chamber of Bosnia and Herzegovina has established and maintains the Association of Fish Producers. The Chamber supports the nine registered members, who are the biggest producers and main fish exporters of the country, in their export and import activities. The main objective of the chamber is to increase tax free export quotas. According to data from the Chamber, 2,406 tonnes, which is a substantial part of fish production, was exported in 2011. More than half of exports went to EU countries as fresh products on ice. A small amount of fish is exported in smoked form. In 2013 the total export of fish and fishery products was BAM18m, while the total value of imports (around 11,000 tonnes) were BAM52.5m.
Fish produced on farms is sold directly to farm-gate consumers or to supermarkets, specialised fish shops and restaurants. There is no wholesale fish market in the country. Approximately 65 percent of the total production of fish is sold in domestic markets. The fish supply in the country is mainly maintained through supermarkets, specialised units of food markets and retailer shops. A significant part of the fish is sold on-farm in gutted form while in supermarkets, fish shops and fish markets it is sold mainly gutted and iced. The majority of fish is consumed during the Christmas period in Republika Srpska.
|
| Table 3 Imports of fish and seafood to Bosnia and Herzegovina | Imports of | 2010 | 2011 | 2012 | 2013 | Value (BAM) | Quantity (kg) | Value (BAM) | Quantity (kg) | Value (BAM) | Quantity (kg) | Value (BAM) | Quantity (kg) | Fish | 14,041,617 | 5,175,933 | 14,300,323 | 4,924,723 | 16,165,318 | 4,607,712 | 15,699,654 | 4,954,906 | Processed fish | 30,650,894 | 5,799,617 | 28,913,201 | 4,868,989 | 31,860,640 | 4,688,115 | 31,791,949 | 4,670,647 | Crustaceans | 407,973 | 37,841 | 440,179 | 39,940 | 441,433 | 38,440 | 374,600 | 38,545 | Molluscs | 2,685,218 | 814,120 | 3,213,881 | 932,464 | 3,017,063 | 870,844 | 4,169,326 | 1,270,247 | Processed crustaceans and molluscs | 444,286 | 95,967 | 424,691 | 81,896 | 641,361 | 135,212 | 457,872 | 96,870 | Total | 48,229,988 | 11,923,478 | 47,292,275 | 10,848,012 | 52,125,815 | 10,340,323 | 52,493,401 | 11,031,215 | ||||||||||||||||||||||||||||||||||||||||||||||||||||||||||||||||||||||||||||||||
| Table 3 Imports of fish and seafood to Bosnia and Herzegovina | ||||||||||||||||||||||||||||||||||||||||||||||||||||||||||||||||||||||||||||||||||||||||||||||||||||||||||||||||||||||||||||||||||||||||||||||||||||
| Imports of | 2010 | 2011 | 2012 | 2013 | ||||||||||||||||||||||||||||||||||||||||||||||||||||||||||||||||||||||||||||||||||||||||||||||||||||||||||||||||||||||||||||||||||||||||||||||||
| Value (BAM) | Quantity (kg) | Value (BAM) | Quantity (kg) | Value (BAM) | Quantity (kg) | Value (BAM) | Quantity (kg) | |||||||||||||||||||||||||||||||||||||||||||||||||||||||||||||||||||||||||||||||||||||||||||||||||||||||||||||||||||||||||||||||||||||||||||||
| Fish | 14,041,617 | 5,175,933 | 14,300,323 | 4,924,723 | 16,165,318 | 4,607,712 | 15,699,654 | 4,954,906 | ||||||||||||||||||||||||||||||||||||||||||||||||||||||||||||||||||||||||||||||||||||||||||||||||||||||||||||||||||||||||||||||||||||||||||||
| Processed fish | 30,650,894 | 5,799,617 | 28,913,201 | 4,868,989 | 31,860,640 | 4,688,115 | 31,791,949 | 4,670,647 | ||||||||||||||||||||||||||||||||||||||||||||||||||||||||||||||||||||||||||||||||||||||||||||||||||||||||||||||||||||||||||||||||||||||||||||
| Crustaceans | 407,973 | 37,841 | 440,179 | 39,940 | 441,433 | 38,440 | 374,600 | 38,545 | ||||||||||||||||||||||||||||||||||||||||||||||||||||||||||||||||||||||||||||||||||||||||||||||||||||||||||||||||||||||||||||||||||||||||||||
| Molluscs | 2,685,218 | 814,120 | 3,213,881 | 932,464 | 3,017,063 | 870,844 | 4,169,326 | 1,270,247 | ||||||||||||||||||||||||||||||||||||||||||||||||||||||||||||||||||||||||||||||||||||||||||||||||||||||||||||||||||||||||||||||||||||||||||||
| Processed crustaceans and molluscs | 444,286 | 95,967 | 424,691 | 81,896 | 641,361 | 135,212 | 457,872 | 96,870 | ||||||||||||||||||||||||||||||||||||||||||||||||||||||||||||||||||||||||||||||||||||||||||||||||||||||||||||||||||||||||||||||||||||||||||||
| Total | 48,229,988 | 11,923,478 | 47,292,275 | 10,848,012 | 52,125,815 | 10,340,323 | 52,493,401 | 11,031,215 | ||||||||||||||||||||||||||||||||||||||||||||||||||||||||||||||||||||||||||||||||||||||||||||||||||||||||||||||||||||||||||||||||||||||||||||
|
| Table 4 Exports of fish and seafood from Bosnia and Herzegovina | Exports of | 2010 | 2011 | 2012 | 2013 | Value (BAM) | Quantity (kg) | Value (BAM) | Quantity (kg) | Value (BAM) | Quantity (kg) | Value (BAM) | Quantity (kg) | Fish | 14,207,732 | 3,144,433 | 14,131,804 | 2,980,075 | 12,507,908 | 2,333,672 | 11,210,804 | 1,975,908 | Processed fish | 21,376 | 3,925 | 9,173 | 982 | 6,191 | 195 | 30,510 | 1,794 | Crustaceans | 11,059 | 581 | 4,087 | 248 | 10,508 | 917 | 22,016 | 1,307 | Molluscs | 383,479 | 190,899 | 4,769,058 | 422,126 | 4,224,382 | 539,834 | 6,617,459 | 66,068 | Processed crustaceans and molluscs | 3,579,515 | 304,883 | 508,231 | 44,330 | 481 | 80 | 347 | 40 | Total | 18,203,161 | 3,644,721 | 19,422,353 | 3,447,761 | 16,749,470 | 2,874,698 | 17,881,136 | 2,045,117 | ||||||||||||||||||||||||||||||||||||||||||||||||||||||||||||||||||||||||||||||||
| Table 4 Exports of fish and seafood from Bosnia and Herzegovina | ||||||||||||||||||||||||||||||||||||||||||||||||||||||||||||||||||||||||||||||||||||||||||||||||||||||||||||||||||||||||||||||||||||||||||||||||||||
| Exports of | 2010 | 2011 | 2012 | 2013 | ||||||||||||||||||||||||||||||||||||||||||||||||||||||||||||||||||||||||||||||||||||||||||||||||||||||||||||||||||||||||||||||||||||||||||||||||
| Value (BAM) | Quantity (kg) | Value (BAM) | Quantity (kg) | Value (BAM) | Quantity (kg) | Value (BAM) | Quantity (kg) | |||||||||||||||||||||||||||||||||||||||||||||||||||||||||||||||||||||||||||||||||||||||||||||||||||||||||||||||||||||||||||||||||||||||||||||
| Fish | 14,207,732 | 3,144,433 | 14,131,804 | 2,980,075 | 12,507,908 | 2,333,672 | 11,210,804 | 1,975,908 | ||||||||||||||||||||||||||||||||||||||||||||||||||||||||||||||||||||||||||||||||||||||||||||||||||||||||||||||||||||||||||||||||||||||||||||
| Processed fish | 21,376 | 3,925 | 9,173 | 982 | 6,191 | 195 | 30,510 | 1,794 | ||||||||||||||||||||||||||||||||||||||||||||||||||||||||||||||||||||||||||||||||||||||||||||||||||||||||||||||||||||||||||||||||||||||||||||
| Crustaceans | 11,059 | 581 | 4,087 | 248 | 10,508 | 917 | 22,016 | 1,307 | ||||||||||||||||||||||||||||||||||||||||||||||||||||||||||||||||||||||||||||||||||||||||||||||||||||||||||||||||||||||||||||||||||||||||||||
| Molluscs | 383,479 | 190,899 | 4,769,058 | 422,126 | 4,224,382 | 539,834 | 6,617,459 | 66,068 | ||||||||||||||||||||||||||||||||||||||||||||||||||||||||||||||||||||||||||||||||||||||||||||||||||||||||||||||||||||||||||||||||||||||||||||
| Processed crustaceans and molluscs | 3,579,515 | 304,883 | 508,231 | 44,330 | 481 | 80 | 347 | 40 | ||||||||||||||||||||||||||||||||||||||||||||||||||||||||||||||||||||||||||||||||||||||||||||||||||||||||||||||||||||||||||||||||||||||||||||
| Total | 18,203,161 | 3,644,721 | 19,422,353 | 3,447,761 | 16,749,470 | 2,874,698 | 17,881,136 | 2,045,117 | ||||||||||||||||||||||||||||||||||||||||||||||||||||||||||||||||||||||||||||||||||||||||||||||||||||||||||||||||||||||||||||||||||||||||||||
Fish and seafood prices
The average price of “river and lake fish” was BAM4.1 (EUR2.05) per kg in 2013 in the Republika Srpska. Farm surveys reveal that the price of trout sold on a large scale varies from between BAM 5.5 and 6.5 per kg across the country. The retail farm-gate price of live trout is about BAM 7 per kg while that of gutted ones is BAM 9. These prices which may seasonally change are similar in the FBiH and BD. According to FAO statistics, per capita consumption of fish and fish products was estimated to be 5.85 kg in 2011.
Several measures needed to develop sector
There are three fields in which actions are needed in order to improve the efficiency and support the sustainable development of the sector. These are: sector administration; capacity building of key stakeholders; and support for basic investment in the field of both fisheries and aquaculture. Improved sector administration is the first step to be completed. This should include strategic action in the form of upgrading the status of the sector, improving sector administration with state level coordination measures, improving legislation, enforcing laws, and public friendly licensing of existing and new fish farms.
| Table 5 Production and capacities of main exporting freshwater fish farms, 2011 | ||||
| Exporter | Area (m2) | Annual capacity (t) | Species | Production (t) |
| Tropic fishery | 27,700 | 1,500 | Trout | 1,350 |
| Norfish Blagaj | 9,320 | 900 | Trout | 276 |
| Laks | 1,052 | 350 | California trout, brook trout, red trout, carp, endemic species | 150 |
| Total | 38,072 | 2,750 | 1,876 |
Capacity building includes technical support and training for government organisations to improve services as well as to fisheries/angling organisations and fish farmers. The third group of recommended interventions in the field of inland fisheries and aquaculture include equipping angling associations and fish farms, installing mechanical filters at land based trout farms, and equipping fish farms with fish transport equipment and with fish processing and preserving units.
This article is condensed from a report by the Department for Agriculture, Food, Forestry and Rural Development, Ministry of Foreign Trade and Economic Relations of Bosnia and Herzegovina